

Margins decided by inputs
Fertiliser and lime are among the biggest costs per hectare of grain. We size nitrogen, phosphorus and potassium to the yield each land can realistically deliver, measured rather than copied from last year's programme.
Grain · Graan
Grain margins are thin, and inputs are one of the few costs you control. We measure the soil and the crop, and make sure the correct inputs go on at the correct amount in the correct place, independent of any fertiliser supplier.
What we measure, and when
Each sample is timed to the crop stage where it tells you the most. We work across the Swartland and the other Western Cape grain areas.
| Season, July to June | Jul | Aug | Sep | Oct | Nov | Dec | Jan | Feb | Mar | Apr | May | Jun |
|---|---|---|---|---|---|---|---|---|---|---|---|---|
| PlantingWinter rainfall, mostly dryland | Apr | May | Jun | |||||||||
| Tillering to flag leaf | Jul | Aug | Sep | |||||||||
| Flowering & grain fill | Sep | Oct | ||||||||||
| Harvest | Oct | Nov | Dec | |||||||||
| Soil samplingAfter harvest, before liming and planting | Dec | Jan | Feb | Mar | ||||||||
| Tissue sampleTillering, before nitrogen top-dressing | Jul | Aug | ||||||||||
| NDVI monitoring & scoutingSatellite imagery through the season | Jul | Aug | Sep | Oct | Jun |
What we look for
The questions we put to every block's numbers — answered independently, with no product attached to the answer.
Fertiliser and lime are among the biggest costs per hectare of grain. We size nitrogen, phosphorus and potassium to the yield each land can realistically deliver, measured rather than copied from last year's programme.
Many Western Cape grain soils are acidic, and in acid subsoils aluminium stunts the roots. Sampling topsoil and subsoil shows where lime will pay, and how much.
Nitrogen is the biggest lever on yield and protein, and the easiest to waste. We time top-dressing to tillering and soil moisture, and size it to the crop's potential.
Grain lands run from heavy soils to sand within one field. Variable-rate lime, phosphorus and potassium put the money where it pays, as a file your spreader can run.
By the time a patch is visible from the bakkie, yield is already lost. NDVI imagery flags stressed areas early, so we scout there for pests, disease or waterlogging and you act sooner.
Canola needs more sulphur and boron; legumes and pastures leave nitrogen behind for the next crop. Programmes follow the rotation, not just this season's crop.
What you get back
We keep every result, so this season's numbers always sit beside last season's — and you get a written report after every visit.
Other crops
Contact
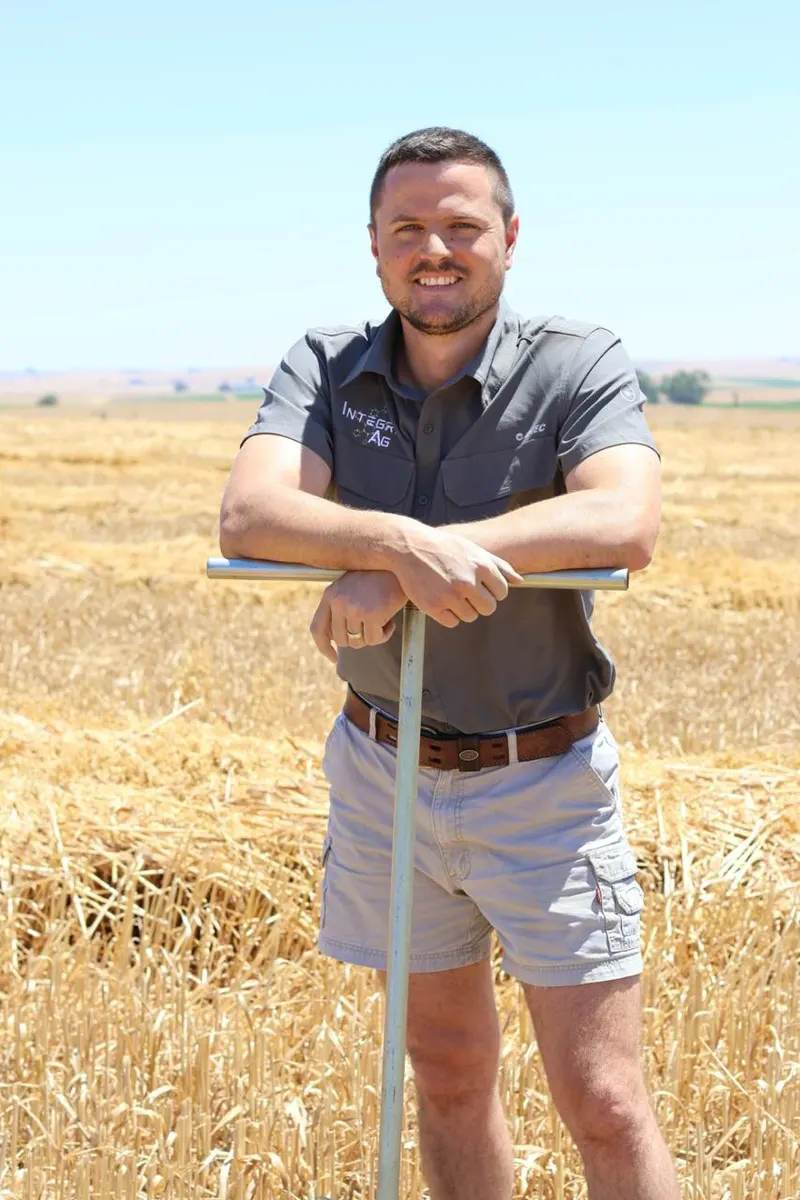
Evert Bergh, agronomist. Based in Durbanville, serving farmers across the Swartland and the other Western Cape grain areas, and nationally.